
NRL Player Prop Bets: Tackles, Metres, and Try Assists Markets
 Available in US
Try scorer bets get all the glory. They are simple, exciting, and settle with a replay on the big screen. But the NRL’s player prop markets extend far beyond who crosses the try line, and for bettors willing to learn the less glamorous stats, these markets offer some of the most consistent value in rugby league. Tackles made, running metres, try assists, kick metres, offloads, and line breaks each have their own over/under lines, and each rewards a slightly different kind of analysis.
The appeal of player props is specificity. Instead of predicting the outcome of an entire match, you are predicting one player’s performance in one measurable category. You can be entirely wrong about who wins, by how much, and how many points are scored, and still collect on a tackle count bet because a middle forward did exactly what middle forwards do. That independence from match outcome is a structural advantage.
The Tackles Market: Predictable by Design
Of all player prop markets, tackles made is the most statistically stable. Middle forwards and hookers in the NRL make between 25 and 45 tackles per game, and their individual averages fluctuate far less than try-scoring or metres numbers. A lock forward who averages 36 tackles per game will rarely dip below 28 or spike above 48. That narrow band of variation makes the market relatively predictable, which is exactly what systematic bettors want.
Bookmakers set the over/under line for tackles based on a player’s recent average, usually weighted toward the last five to eight games. The key to finding value is identifying situations where the upcoming match is likely to push a player’s tackle count above or below his recent norm. If a middle forward’s team is expected to defend more than usual because it faces a dominant possession side, his tackle count will rise. If his team is the dominant side, he will spend more time in attack and fewer sets on his own try line, pulling his count down.
Interchange patterns add another variable. NRL coaches rotate their middle forwards through the bench, and the number of minutes a player spends on the field directly determines his tackle ceiling. A prop who plays 50 minutes will make fewer tackles than one who plays 65, regardless of the match dynamics. Checking the team’s recent interchange usage patterns, and watching for any pre-game comments from the coach about workload management, can give you the extra data point that shifts a borderline bet into a confident one.
Team matchups matter in this market more than people realise. When two evenly matched sides meet, possession tends to be shared, and tackle loads spread evenly across both packs. But when a bottom-four team hosts a top-four side, the weaker team often defends for long stretches, and their middle forwards record inflated tackle numbers as a result. If the bookmaker’s line is based on the player’s season average rather than the specific matchup, the over can be a strong play.
Running Metres: Where Talent Meets Opportunity
Running metres is a flashier stat than tackles, and the market is more volatile as a result. A fullback’s metre tally can swing from 80 to 250 depending on how often his team is returning kicks, whether he runs hard from dummy half late in sets, and how porous the opposition’s edge defence is. That volatility creates wider spreads between the over and under prices, and wider spreads mean bigger opportunities when you have a strong opinion.
The first thing to understand about running metres lines is that they reward players who touch the ball frequently in open space. Fullbacks and ball-running back-rowers consistently record the highest metres figures, followed by edge forwards who carry out of yardage. Middle forwards accumulate metres too, but in shorter bursts through traffic, so their totals tend to cluster in a tighter range.
Kick-return metres are the hidden engine of this market. A fullback whose team concedes a lot of territory through kicks will field more returns and accumulate more metres, even if his attacking game is quiet. Teams that apply heavy kicking pressure to one side of the field funnel returns to the opposition’s fullback or winger, inflating that player’s metres count. If you know which team kicks long and which side they target, you can anticipate which opposing player will likely exceed his running metres line.
Opposition defensive quality deserves equal weight. A ball-carrying back-rower facing a team that misses 30-plus tackles per game will find holes and post-contact metres that inflate his total. The same player against a miserly defensive unit might struggle to hit his average. Cross-referencing a player’s upcoming opponent’s missed tackle rate with the player’s carries-per-game figure gives you a rough but useful prediction of his metres output.
Try Assists and the Niche Markets Worth Exploring
Try assists are where playmakers earn their money, and the betting market around them is still maturing. A try assist is credited to the player who provides the final pass or kick leading to a try. Halfbacks, five-eighths, and hookers dominate this stat, though second-rowers with good ball skills occasionally feature. The over/under lines for try assists typically sit at 0.5 or 1.5, making it a binary-style market: either the player assists a try or he does not.
The appeal here is the connection between a team’s try-scoring volume and its primary ball distributor’s assist count. If you expect a team to score four or more tries in a match, the probability that its main playmaker registers at least one assist is very high. This means try assist overs correlate with totals overs for the player’s team, and you can use your team-level scoring projection to inform an individual player bet. A halfback whose team is expected to dominate an opposition with a weak right-edge defence is far more likely to rack up assists than the same player in a grinding arm-wrestle.
Kick metres is another market gaining traction. It applies almost exclusively to halfbacks and fullbacks who share the kicking duties. The over/under line reflects how many metres a player accumulates through his kicking game, including bombs, grubbers, and long clearing kicks. Teams that play a territory-based style, relying on their halfback to pin opponents deep, naturally produce higher kick metres figures. If a halfback’s team is expected to control possession and play on the front foot, his kick metres line becomes an attractive over prospect.
Offload markets remain the most unpredictable of all player props, and for good reason. Offloading depends on contact dynamics that are nearly impossible to forecast. A back-rower might throw three offloads one week and zero the next, facing the same quality of opposition. Unless you have a very specific thesis about match tempo and defensive technique that would encourage or discourage offloading, this market is best avoided or treated as a small-stake speculative play.
See also NRL try scorer markets.
Finding Value Across Player Prop Markets
The overriding principle in player props is the same as in any betting market: find situations where your assessment of a player’s likely output diverges from the bookmaker’s line. But props offer a structural advantage that match-level markets do not. Because bookmakers set lines for dozens of players across every match, their attention and modelling precision are spread thin. A bookmaker will spend significant resources calibrating the match winner and handicap lines because those markets attract the largest volumes. Player prop lines, by contrast, often rely on simpler averages and receive less manual adjustment.
This creates systematic opportunities in a few areas. First, players returning from injury or suspension whose recent averages are dragged down by a small sample size. If a prop forward missed three weeks and his tackles line is set based on only two post-return games where he was on restricted minutes, the line may be too low once he returns to full game time. Second, players whose roles have recently changed. A centre moved to the wing, or a bench utility promoted to starting lock, will face a different workload profile that the market takes time to absorb.
Third, monitor the impact of opposition injuries on your player’s props. If the opposing team loses its starting hooker and replaces him with a bench utility who provides slower service from dummy half, the defensive line pressure on the attacking team decreases. This can boost running metres for ball-carriers on the favoured side and suppress tackle counts for the opposition’s middle forwards. The interconnectedness of these markets is where deep analysis pays off.
Traps That Catch Prop Bettors
The most common trap in player prop betting is over-reliance on season averages without adjusting for context. A fullback who averages 150 running metres per game across the season has a very different outlook when facing the competition’s best defence compared to the worst. Flat averages ignore matchup difficulty entirely, and bettors who use them uncritically will find themselves on the wrong side of the line in disproportionately important games.
Another trap is assuming that strong recent form will continue indefinitely. A hooker who has posted 40-plus tackles in three consecutive weeks might be on a streak driven by his team defending poorly and conceding a lot of possession. If the team’s defence improves or the upcoming opponent is less possession-dominant, his tackle count could revert sharply toward his longer-term average.
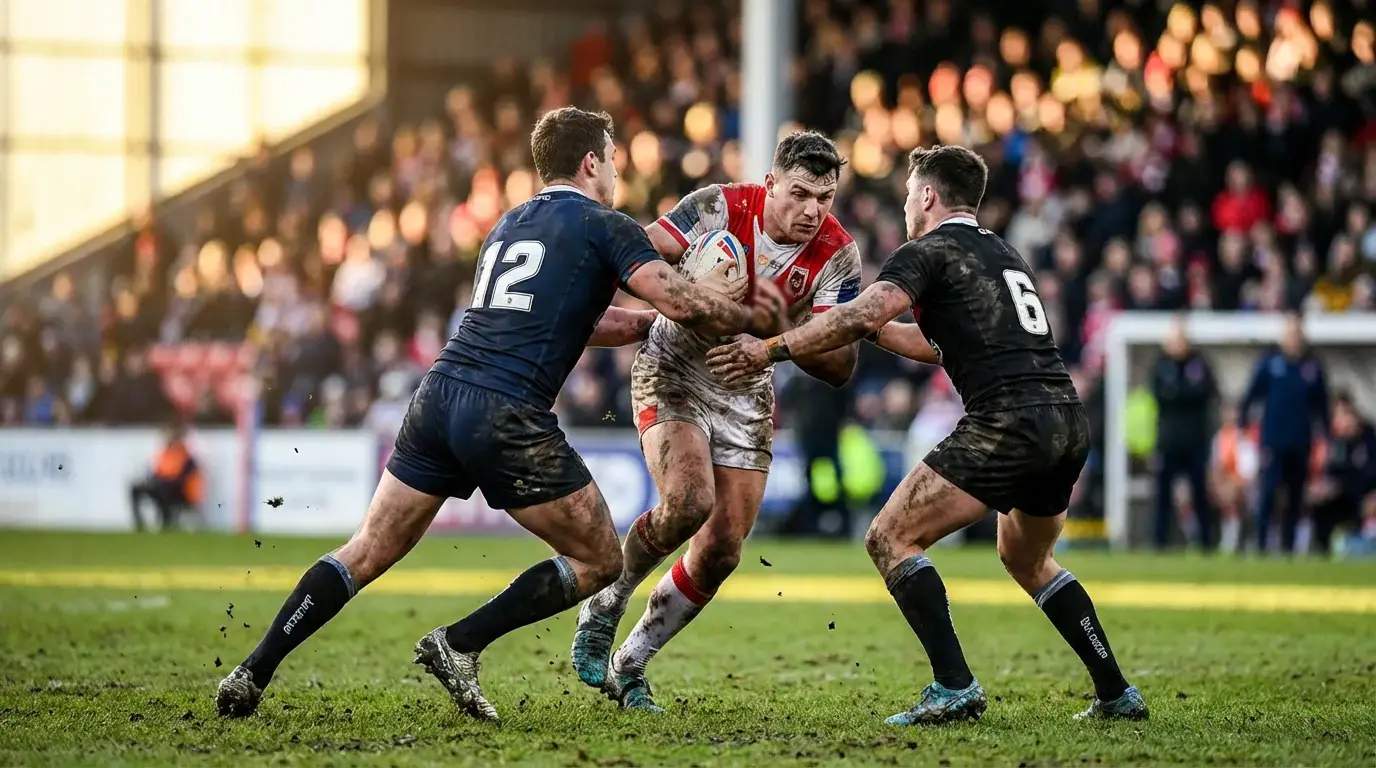
Finally, beware of market correlation when building same-game multis from player props. A bet that combines one player’s over on running metres with another player’s over on tackles sounds diversified, but if both outcomes depend on the same match dynamic, such as one team dominating possession, the legs are not independent. The bookmaker prices each leg individually but does not always adjust for correlation, which can either inflate or suppress the true probability of the combined bet landing. NRL player prop bets on rugby league betting tips.
The Stat Sheet Is the Scouting Report
Player prop markets reward a specific kind of bettor: one who watches games with a spreadsheet open, tracks individual workloads across seasons, and understands how team dynamics funnel statistical output to specific players. These markets are not about star power or name recognition. They are about minutes played, defensive sets faced, and kick-return frequency. The stat sheet is not a supplement to your analysis. It is the analysis. And in a market where bookmakers spread their attention thin, the bettor who focuses tightly on a handful of well-understood props will find edges that the match-level markets simply cannot offer.
