
Half-Time/Full-Time Betting in Rugby League: Strategy and Examples
 Available in US
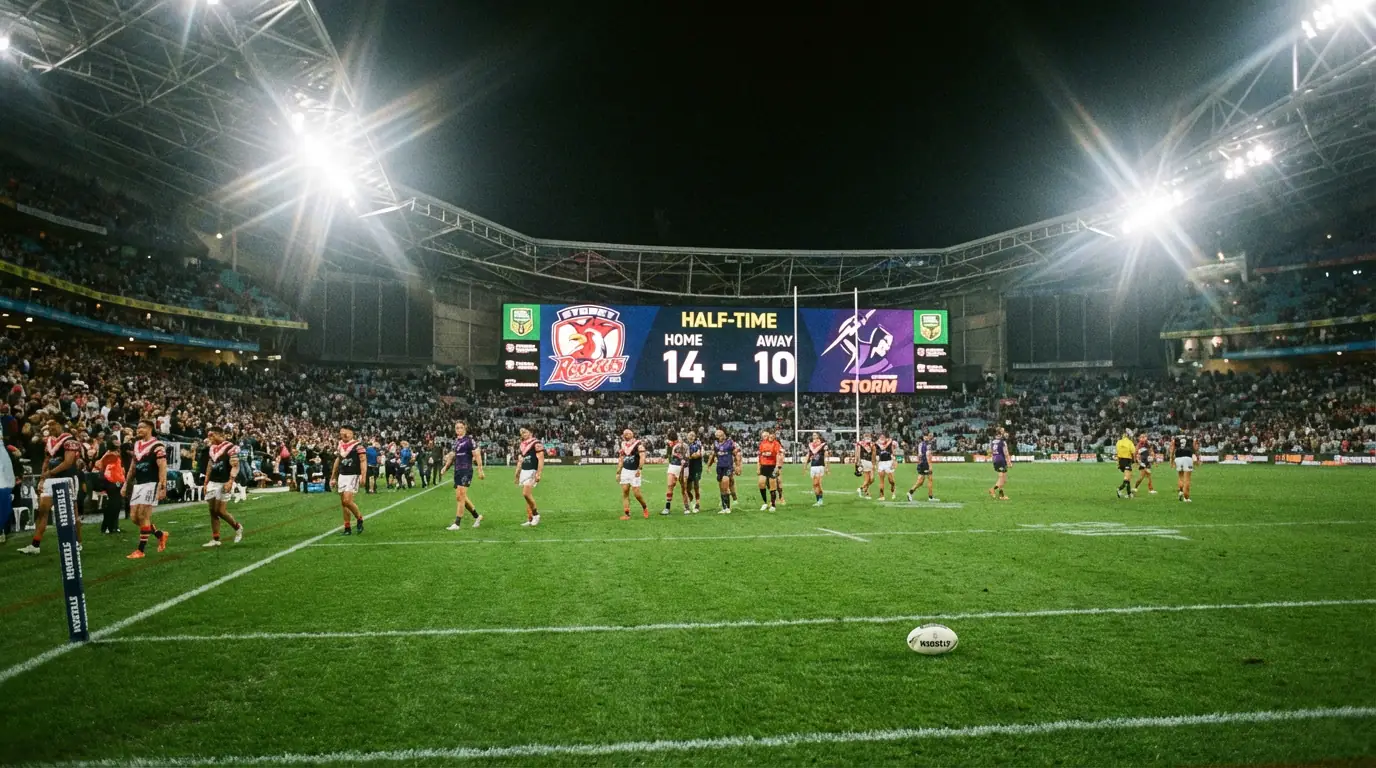
Half-time/full-time is one of the oldest exotic markets in rugby league betting, and it remains one of the most consistently mispriced. The concept is simple: you predict both the half-time leader and the full-time winner. Get both right, and you are paid at substantially higher odds than a standard match winner bet. Get either wrong, and you lose.
The reason this market offers persistent value is structural. HT/FT pricing is based on a model that estimates the probability of each possible combination — Home/Home, Home/Draw, Home/Away, Draw/Home, Draw/Draw, Draw/Away, Away/Home, Away/Draw, Away/Away — and assigns odds accordingly. The bookmaker’s challenge is that the model must account for how rugby league games change between halves, and that transition is harder to price than either half in isolation. Fatigue, tactical adjustments, weather shifts, and the psychological dynamics of leading or trailing all affect second-half outcomes in ways that statistical models capture imperfectly.
For the bettor who understands these dynamics, HT/FT is not just a novelty market. It is a legitimate edge opportunity that pays at prices the standard match winner market cannot match.
How the Market Works and Where It Breaks
The HT/FT market offers nine possible outcomes. In practice, three of them account for the vast majority of results in NRL and Super League matches. Home/Home — the home team leads at the break and wins the game — is the most common outcome, occurring in roughly 30-35% of all games. Away/Away is the second most common, at around 20-25%. Draw/Home or Draw/Away — where the scores are level at half-time but one team wins — collectively account for another 15-20%.
The remaining combinations are where the bookmaker’s model starts to struggle. Turnaround results — where the team leading at half-time loses the game — are genuinely rare in rugby league, occurring in only about 8-12% of matches. But within that small sample, the pricing can be wildly off because the model has limited data to calibrate from. A Home/Away result at $21.00 may actually occur at a rate closer to one in fifteen games under certain conditions, making it a value bet despite the long odds.
The key insight is that the bookmaker prices most of the nine outcomes using the same underlying model, and that model is calibrated to the average game. It does not adequately account for the specific circumstances of individual match-ups. A game between the competition leader and a bottom-four team will have very different half-time dynamics than a game between two mid-table teams, but the HT/FT model often fails to differentiate as sharply as it should.
Understanding which circumstances produce unusual half-time distributions is the core skill of HT/FT betting. A team that starts slowly but finishes strongly — a characteristic that is remarkably consistent for certain NRL squads across entire seasons — will produce more Draw/Team and Opposition/Team results than the model expects. A team that blitzes opponents in the opening twenty minutes but fades after half-time will produce more Team/Draw and Team/Opposition outcomes.
The Combinations That Offer Genuine Value
Not all nine HT/FT outcomes are created equal from a value perspective. Some are priced efficiently because they occur frequently and the model has ample data to work with. Others are systematically mispriced because the model applies average rates to situations that deviate significantly from the average.
The Draw/Favourite combination is the single most consistently underpriced outcome in rugby league HT/FT markets. The logic is straightforward: many NRL games are tight at half-time, particularly when both teams are competitive. The half-time score in the NRL is a draw or within one converted try approximately 40% of the time. When the stronger team is involved in one of these tight first halves, their superior depth, fitness, and bench rotations typically tell in the second half. The model prices the Draw/Favourite outcome based on the overall frequency of drawn half-times, but it under-weights how often the better team pulls away when the game is level at the break.
The Underdog/Underdog combination is another interesting play, but only in specific circumstances. When a genuine underdog has a strong record of fast starts — typically indicated by a high first-half points-scored average relative to their second-half output — the Underdog/Underdog price may overestimate the difficulty of the underdog both leading at half-time and holding on. This is most applicable in games where the underdog has legitimate first-half strengths, such as a dominant opening set structure or a kicking game that pins teams deep early.
The Favourite/Favourite combination is the default option for most casual bettors, and it is almost always fairly priced or even slightly overpriced. The bookmaker knows this is where the public money lands, and the odds reflect that. Unless you have a specific reason to believe the favourite will lead comfortably throughout — a team with an exceptionally high first-half scoring rate against a slow-starting opponent — the Favourite/Favourite price rarely offers value.
Match Patterns That Predict Half-Time Scores
Identifying the likely half-time state of a game is the critical first step in HT/FT betting, and certain match patterns are more reliable indicators than others. The single strongest predictor of a drawn half-time is the combined defensive quality of both teams. When two teams with effective tackle rates above 90% and low missed-tackle counts meet, first halves tend to be cagey, low-scoring affairs where neither side can establish a lead. These are prime candidates for the Draw/Favourite or Draw/Underdog combinations.
Weather conditions amplify this effect. Rain games, as discussed elsewhere, produce lower first-half scoring because teams are more conservative with the ball in the opening forty minutes, treating possession as precious rather than looking for quick strikes. A wet-weather game between two defensively sound teams is the near-ideal set-up for a drawn half-time, and the HT/FT market rarely prices this scenario aggressively enough.
Travel and scheduling provide another pattern. Teams playing away from home after a short turnaround — particularly NRL teams flying interstate on a five-day break — are statistically more likely to start slowly. Their first-half performance tends to be 10-15% below their season average, and they often trail or sit level at the break before improving in the second half as they settle into the game. For their opponents, this creates an unusually high probability of leading at half-time, which feeds directly into the Home/Home and Home/Draw combinations.
The reverse applies to teams coming off a bye week. Well-rested squads with a full preparation window tend to start faster than their season average, making them more likely to lead at half-time. If a team returning from a bye is playing at home against a travel-weary opponent, the probability of that team leading at the break increases substantially — and the HT/FT model does not always reflect the magnitude of this advantage.
Worked Examples: Putting Theory Into Practice
Consider a hypothetical Round 18 NRL match between a team sitting third on the ladder, playing at home, and a team sitting eighth, travelling interstate on a five-day turnaround. The match winner odds are $1.55 for the home side and $2.50 for the visitors. The HT/FT prices might look something like this: Home/Home at $2.10, Draw/Home at $4.50, Away/Home at $9.00, Home/Away at $15.00, Draw/Away at $8.50, and Away/Away at $5.00.
The home team’s seasonal data shows they score 55% of their points in the first half and have the third-highest first-half points differential in the competition. The away team has the second-worst first-half points differential and has trailed at half-time in six of their last eight away games. In this scenario, the Home/Home combination at $2.10 is likely priced close to fair value because the market recognises the home team’s first-half dominance. However, the Draw/Home combination at $4.50 may offer value if the away team’s defensive record suggests they can keep things tight early before fading.
Now flip the conditions. Imagine the same match, but played in heavy rain with a forecast for persistent drizzle throughout. Suddenly the probability of a tight, low-scoring first half increases dramatically. The Draw/Home price of $4.50 becomes significantly more attractive because rain compresses first-half scoring and makes drawn half-times more likely. If you assess the Draw/Home probability at 25% or better in these conditions, the $4.50 price — implying a 22% probability — represents genuine value.
The point of these examples is not to provide specific betting recommendations but to illustrate the analytical process. HT/FT betting rewards the punter who can assess half-time probabilities more accurately than the bookmaker’s model, and the most reliable way to do that is by identifying the match-specific factors that push the half-time distribution away from the average. See also winning margin betting.
The First-Half Specialist Approach
Most bettors dabble in HT/FT as an occasional side market, throwing a speculative bet at an interesting combination when the mood strikes. A more effective approach is to specialise in first-half analysis and use the HT/FT market as your primary betting outlet for selected games.
This means building your pre-match analysis specifically around the question “What will the scoreboard look like at half-time?” rather than the standard question of “Who will win?” The data inputs are different. You care less about 80-minute form and more about first-twenty-minute form: how teams start games, how quickly they score their first points, and how frequently they lead at the break. You track first-half-specific statistics — first-half completion rates, first-half line breaks, first-half penalty counts — and compare them to the full-game numbers to identify teams whose first-half performance diverges significantly from their overall profile.
A team that is average across 80 minutes but exceptional in the first 40 is invisible to most bettors but highly visible in HT/FT markets. Conversely, a team that starts slowly but surges in the second half creates predictable HT/FT patterns that the model under-prices. Building a database of these first-half profiles for all seventeen NRL teams takes a few hours at the start of the season and gives you an analytical edge that very few punters bother to develop. The market rewards the specialist, and HT/FT has fewer specialists than almost any other rugby league betting market. Half-time/full-time betting on rugby league betting tips.
